According to statistics released by The Canadian Real Estate Association (CREA), national home sales edged up slightly on a month-over-month basis in April 2013. Activity has generally held to within short reach of current levels for the past nine months.
Highlights:
- National home sales rose 0.6% from March to April.
- Actual (not seasonally adjusted) activity came in 3.1% below levels in April 2012.
- The number of newly listed homes fell 0.9% from March to April.
- The Canadian housing market remains firmly in balanced territory.
- The national average sale price rose 1.3% on a year-over-year basis in April.
- The MLS® HPI rose 2.2% in April, its smallest gain in more than two years.
The number of home sales processed through the MLS® Systems of real estate Boards and Associations and other cooperative listing systems in Canada edged 0.6 per cent higher on a month-over-month basis in April 2013.
Home sales improved in more than half of all local markets from March to April, led by gains in Greater Toronto, Winnipeg, Calgary, and Victoria.
“National sales activity is stable and the market remains balanced,” said CREA President Laura Leyser. “That said, trends for sales and listings and for the balance between the two can be and often are very different between and within local housing markets, and between property types and neighbourhoods. These trends are important factors in determining pricing. Your local REALTOR® is your best resource for understanding how the housing market is shaping up where you live or might like to.”
Actual (not seasonally adjusted) activity came in 3.1 per cent below levels reported in April 2012, with transactions down on a year-over-year basis in about 60 per cent of local markets.
That compares to a decline of more than 15 per cent in March, with transactions down in more than 90 per cent of all local markets.
“The Easter holiday and an extra full weekend at the end of the month lowered March sales activity and the absence of these factors in April helped sales for the month,” said Gregory Klump, CREA’s Chief Economist.
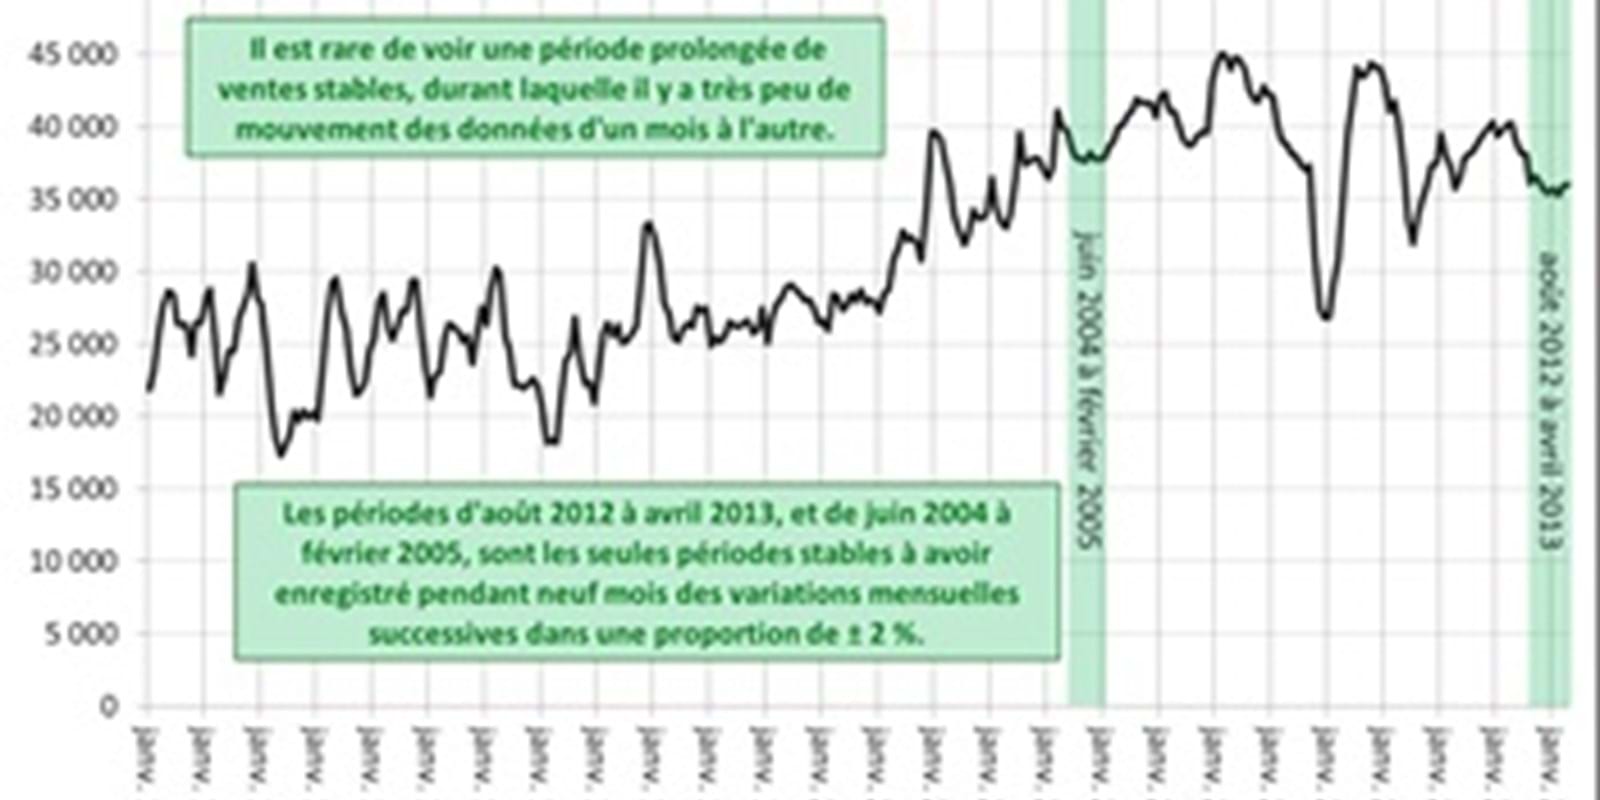
“Since changes to mortgage rules made in 2012 took effect, national sales have been running nine to 10 per cent below levels posted in the first half of 2012 but they’ve been remarkably steady. April activity was on par with where it stood last August, and month-to-month changes since then have held to within a range of plus or minus two per cent.” Monthly changes in national sales activity have held to within this narrow range over a nine month period only once before since CREA’s seasonally adjusted data began in 1988.
The number of newly listed homes fell 0.9 per cent month-over-month in April. New listings were down in about half of all local markets, led by Montreal and much of rural Quebec, as well as Ottawa and Greater Vancouver.
With sales edging up and new listings edging down, the national sales-to-new listings ratio inched up to 50.4 per cent in April compared to 49.7 per cent in March. This measure has held fairly steady around this level for the past nine months.
Based on a sales-to-new listings ratio of between 40 to 60 per cent, two-thirds of all local markets were in balanced market territory in April.
The number of months of inventory is another important measure of balance between housing supply and demand. It represents the number of months it would take to completely liquidate current inventories at the current rate of sales activity.
Nationally, there were 6.6 months of inventory at the end of April 2013. This was unchanged from the end of March and has also held fairly steady around this level for the past nine months.
The actual (not seasonally adjusted) national average price for homes sold in April 2013 was $380,588, representing an increase of 1.3 per cent from the same month last year.
Fewer sales compared to a year-ago levels in Greater Vancouver and Greater Toronto continue to exert a gravitational pull on the national average sale price.
The MLS® Home Price Index (MLS® HPI) is not affected by changes in the mix of sales the way that average price is. For that reason, it provides the best gauge of Canadian home price trends. This month, Saskatoon joins the MLS® HPI.
The Aggregate Composite MLS® HPI rose 2.2 per cent on a year-over-year basis in April.
This marks the eleventh consecutive month in which the year-over-year gain diminished and the slowest growth rate in more than two years.
Year-over-year price gains decelerated for all Benchmark property types tracked by the index with the exception of apartment units in April, with the latter rising by less than inflation.
Price growth remained strongest for one-storey single family homes (+3.1 per cent), followed by two-storey single family homes (+2.6 per cent), townhouse/row units (+1.7 per cent), and apartment units (+1.0 per cent).
Year-over-year price growth in the aggregate MLS® HPI for all Benchmark property types combined was mixed across the markets tracked by the index.